
The Shapiro-Wilk Test: A Practical Guide to Assessing Normality in R, SPSS, JASP, and PSPP
What is the Shapiro–Wilk test?
The Shapiro–Wilk test is a statistical test that tells you whether a data sample follows a normal distribution. Many statistical analyses assume that the data are normally distributed. The Shapiro–Wilk test helps you check this assumption. If the data are not normally distributed, other tests or analytical methods may be required. The test compares the ordering of your data with that of a normal distribution. If the values are close to 1, the data are probably normally distributed. If they are far from 1, the assumption of normality is probably not met.
How is the Shapiro–Wilk test conducted?
Implementation in R with an example
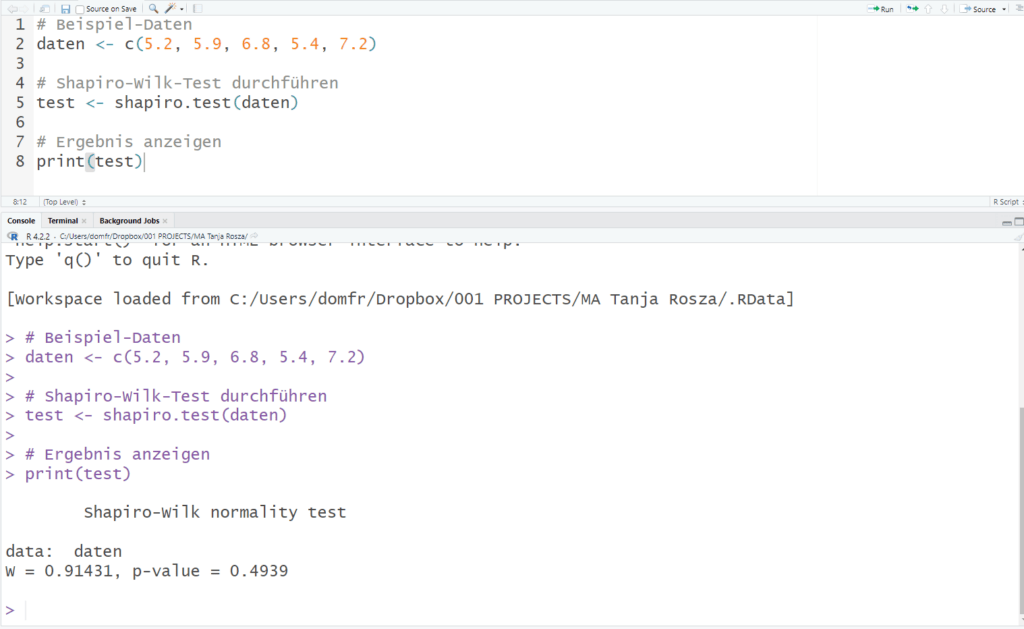
You can easily perform the Shapiro–Wilk test in R. Here is an example:
# Beispiel-Daten
daten <- c(5.2, 5.9, 6.8, 5.4, 7.2)

# Shapiro-Wilk-Test durchführen
test <- shapiro.test(daten)

# Ergebnis anzeigen
print(test)
In this case, you obtain the W statistic and the p-value. The W statistic approaches 1 when the data are normally distributed. The p-value tells you whether the difference is significant. If the p-value is greater than 0.05, you can assume that the data are normally distributed.
Implementation in SPSS
In SPSS, you can perform the Shapiro–Wilk test by following these steps:
- Select “Analyze” > “Descriptive Statistics” > “Explore”.
- Drag the variable to be tested into the “Dependent List” field.
- Click the “Plots” tab and check the “Normality plots with tests” box.
- Click “OK”.
SPSS will then provide you with the results, including the W statistic and the p-value.
Implementation in JASP
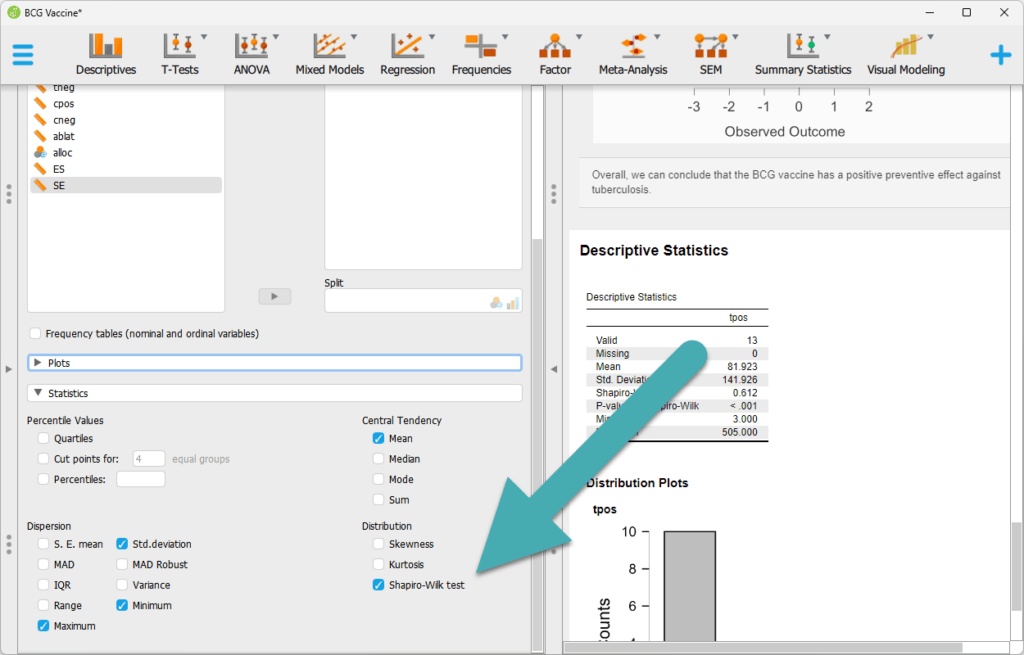
In JASP, the Shapiro–Wilk test is just as easy to perform:
- Load your data.
- Choose “Frequentist” > “Descriptives” > “Descriptive Statistics”.
- Drag the variable you want to test into the “Variables” field.
- Check the box for “Shapiro-Wilk” under “Distribution tests”.
- The results will be displayed in the results view.
Implementation in PSPP
In PSPP, you can perform the Shapiro-Wilk test by:
- Opening or entering your data.
- Selecting “Analyze” > “Non-parametric Tests” > “Explore”.
- Selecting the variable you want to test in the “Dependent List” field.
- Clicking the “Plots” tab and selecting “Normality plots with tests”.
- Clicking “OK”.
The results, including the W statistic and p-value, will be displayed in the output window.
How do you interpret and report the Shapiro-Wilk test?
Let’s assume that you have a W value of 0.98 and a p-value of 0.25. This means that the W statistic is close to 1 and that the p-value is above 0.05. Therefore, you can assume that the data are normally distributed.
Interpreting the Shapiro-Wilk test is straightforward. If the W value is close to 1 and the p-value is above 0.05, this indicates that the data are normally distributed. If the p-value is below 0.05, the data are probably not normally distributed. In this case, other analytical methods or data transformations may be necessary.
If you want to report the results of the Shapiro-Wilk test in APA format, you can use the following structure:
“The Shapiro-Wilk test showed that the data were normally distributed, W = 0.98, p > 0.05.”
Replace the values with the actual results of your test.
Conclusion
The Shapiro-Wilk test is a useful tool for checking whether your data are normally distributed. It is easy to perform and interpret in many statistical programs, including R, SPSS, JASP, and PSPP. Understanding and applying the test can help you choose the right analyses for your data and draw valid conclusions. Whether you are conducting a scientific study or analyzing data for a business project, the Shapiro-Wilk test is an important first step in many statistical analyses. It will help you feel confident in your data and in the decisions based on them.